1
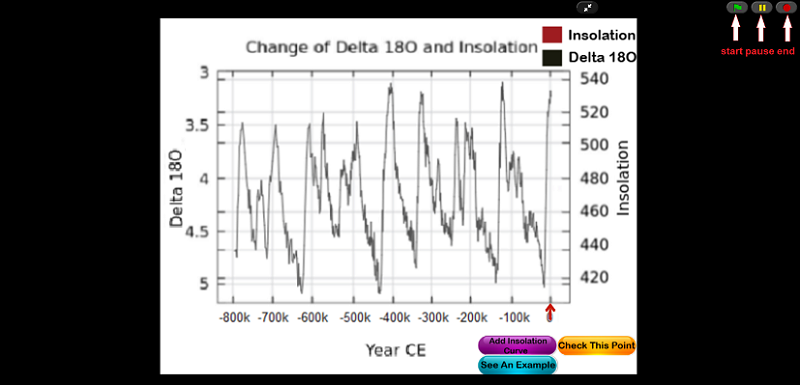
This is what you will see when you click the application link. The application should already have been started. This page shows a graph of delta 18O data from around -800000 CE to 1950 CE.
2
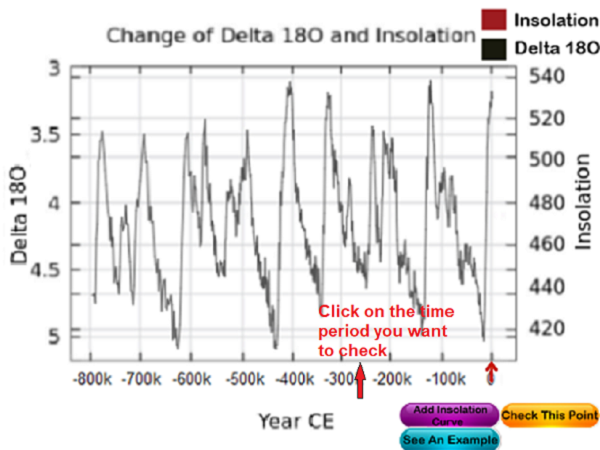
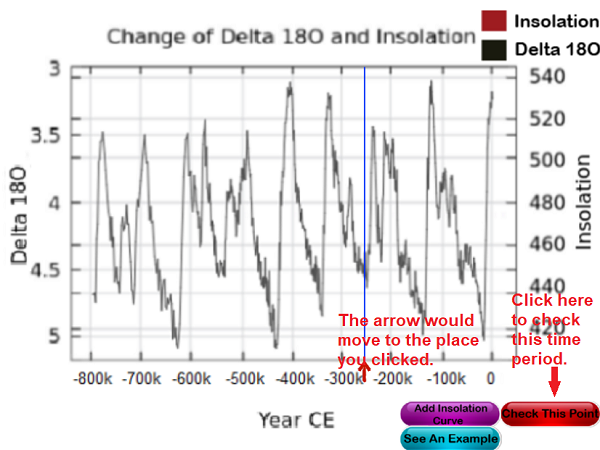
You can choose different time periods of this graph and click on "Check This Point" button to check the curves in these time periods.
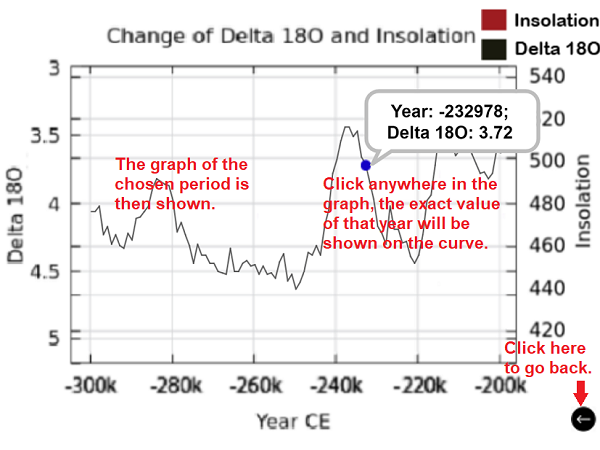
3
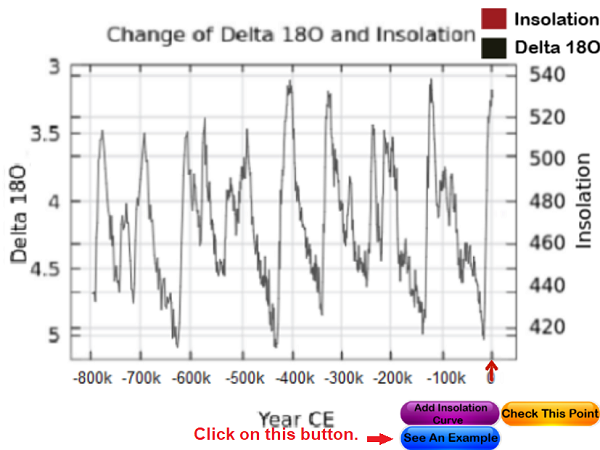
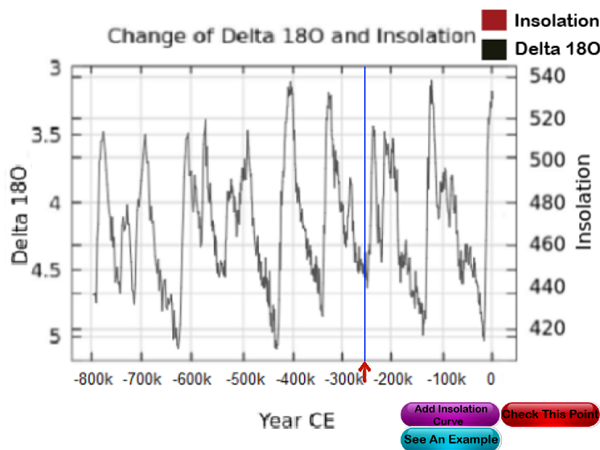
To better understand how to read the graph, you can click on "See An Example" button, which will use graph of one time period to show what upward and downward trends in the curve mean.
4
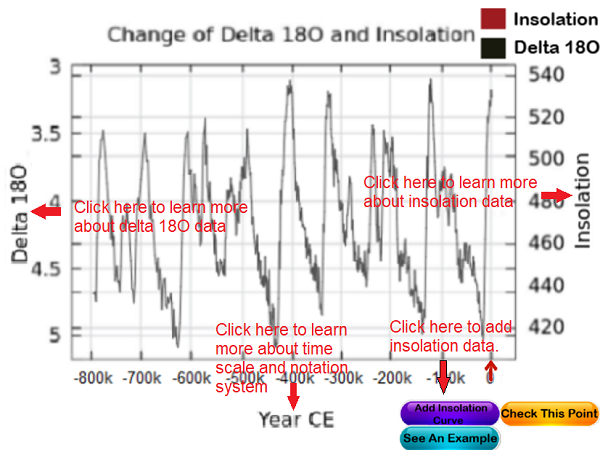
To include insolation data in the curve, click on "Add Insolation Curve" button. To know more about insolation data, click "insolation" on the right side of the graph. To know more about delta 18O data, click "delta 18O" on the left side of the graph. To know more about time scale, time notation system, and the "present" concept, click "time CE" at the bottom of the graph.
5
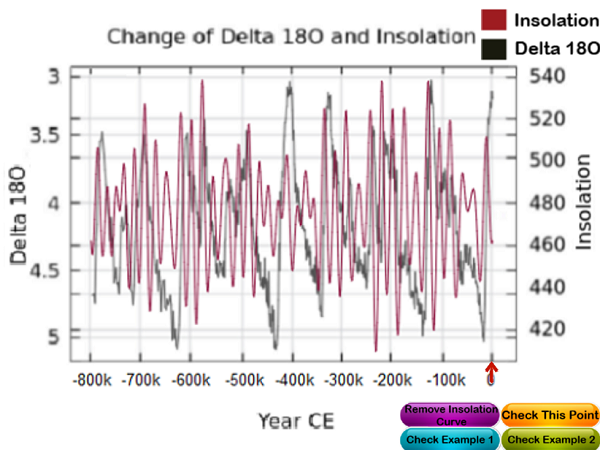
After adding insolation data, the graph will look like the picture below. Same as the graph without insolation data, you can check different time periods and see examples that illustrate how to read the curves.